Blog > AUSTIN Real Estate Market Report | January 2025

AUSTIN Real Estate Market Report | January 2025

by Beata Burgeson

Twitter Facebook Linkedin

Your January 2025 Market Report

Read below to learn what is happening in the Austin real estate market right now.

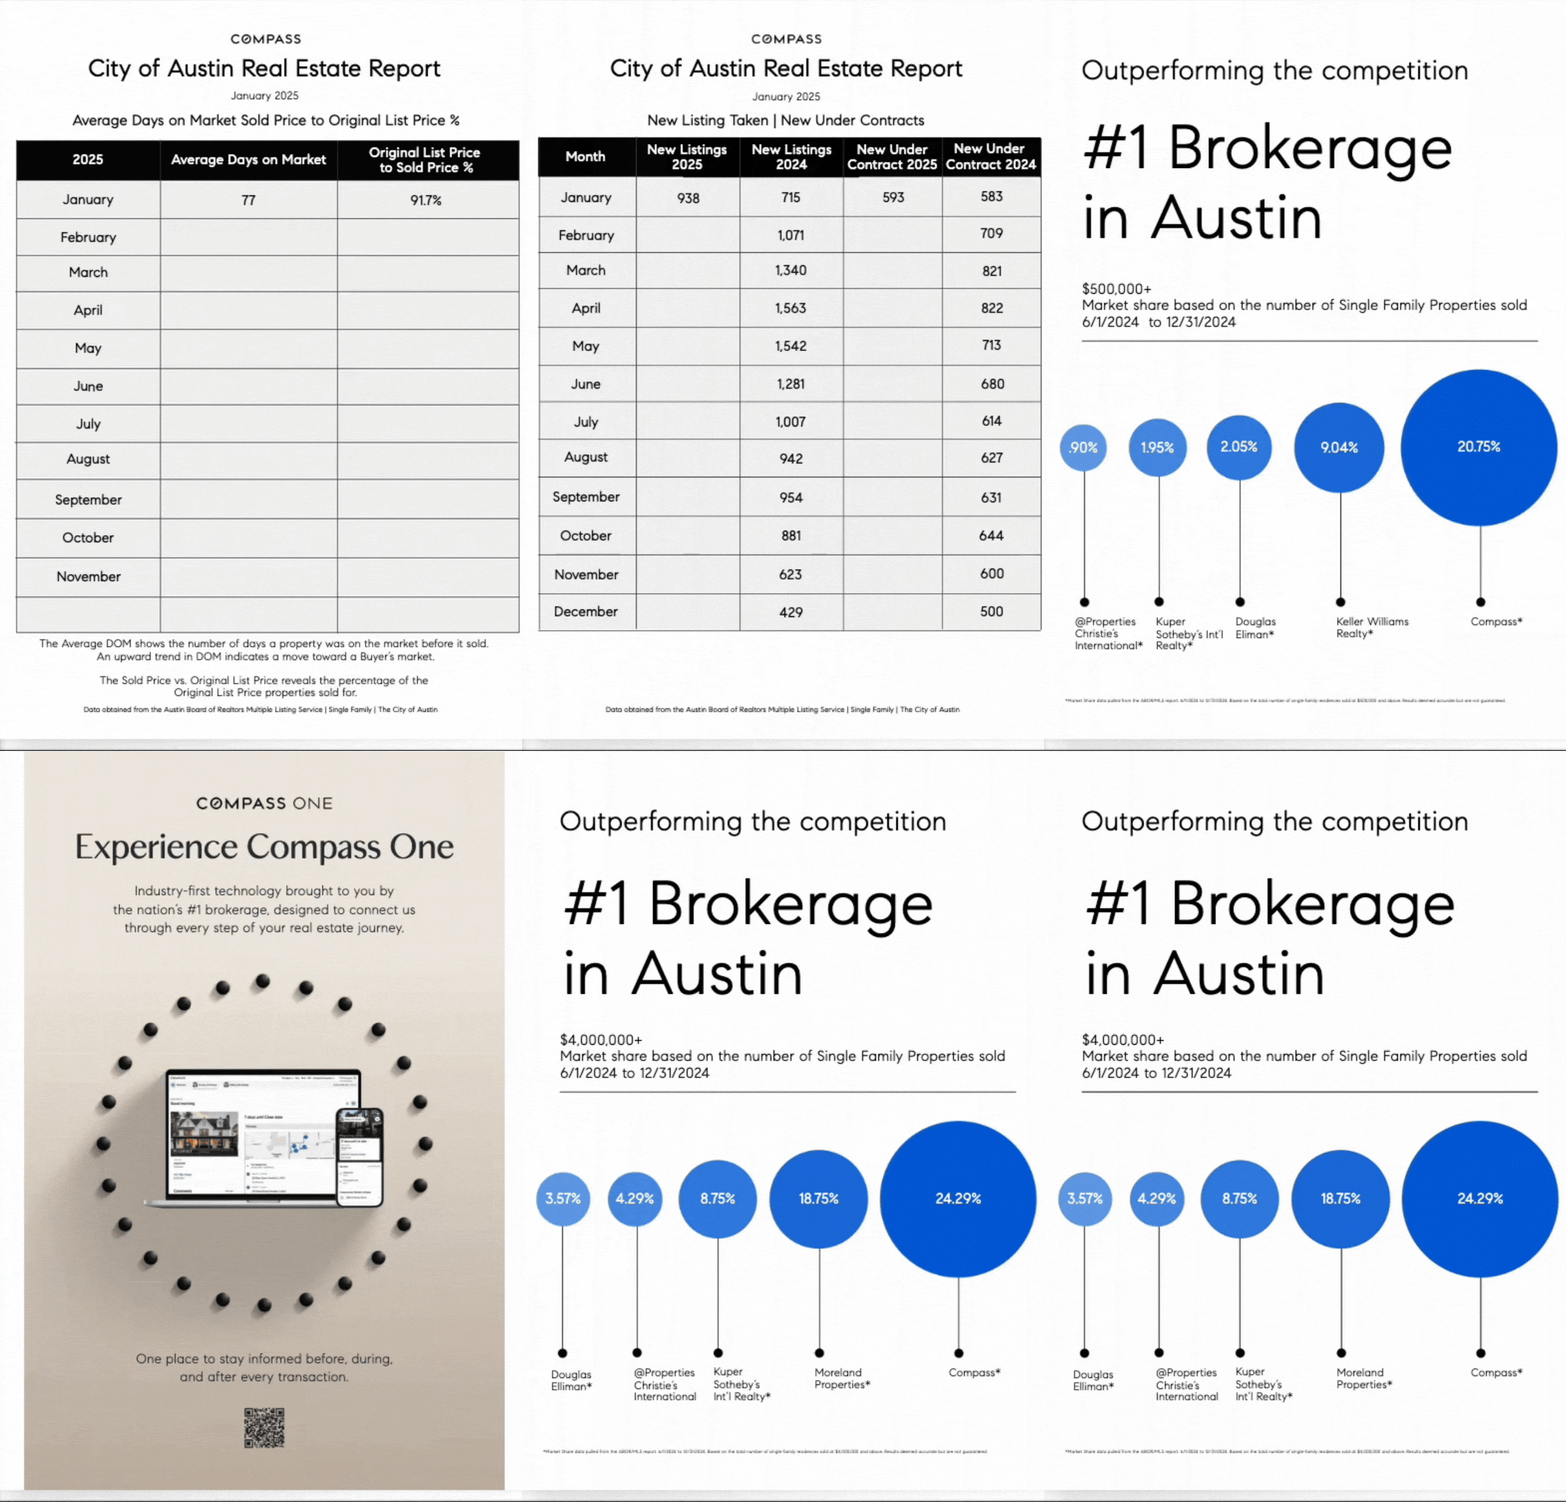
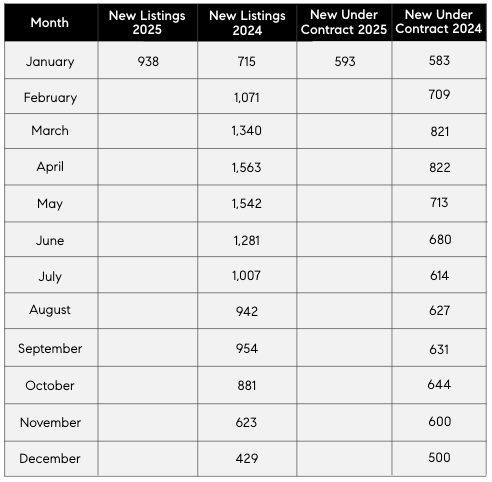
Sellers entered the new year with enthusiasm, as new listings surged over 22% compared to last January, reaching 938.


Click below to view the full January Market Report.


Here’s What You Need to Know


Sellers entered the new year with enthusiasm, as new listings surged over 22% compared to last January, reaching 938.

Buyer activity in Austin, however, remained steady, with approximately 593 new contracts written—a slight change of less than 2% from the previous year. Home prices saw minimal fluctuation,

with the median sales price rising by about 2.2% year-over-year to $569,500.


Homes on Deck in January

Available inventory was up almost 10% from last year, with 2,199 active listings in January. New-to-market listings surged, with 938-- up over 22% year-over-year.


4.9 Months of Inventory

An increase in new inventory and a slight decrease in sold homes brought supply up to almost 5 months' worth-- nearly 1 month's worth more than January of last year.


Sales Pulse

Closed sales were down around 10% from the previous year at 404, and new contracts were down just under 2% at 593.


Price Tag Trends

Median Sales Price: up 2.2% at $569,500

New Contracts Written: down 1.7% at 593

Median List Price U/C = $634,745

Average List Price U/C = $792,778

Median List Price = $599,000

Average List Price = $823,116


Buyer and Seller Clues

Homes took an average of 77 days to sell, down 9 days from January 2025.


The Average Sold Price to Original List Price Ratio is a steady 91.7%.

Up 2% from last year.


All in all, we’re still in a balanced spot. Sellers seem to have confidence, and buyer activity is staying consistent.


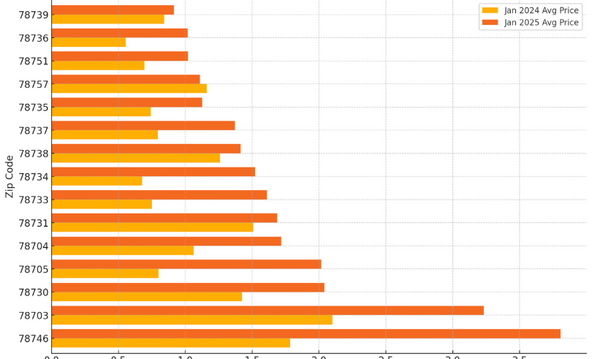
As we saw an increase in new listings at the beginning of 2025, we wanted to understand how sellers feel about the market through their pricing strategies.


By comparing new January 2025 listings to those active in January 2024, we aimed to uncover trends in seller confidence, price shifts, and how different areas respond to current market conditions.


Sellers are listing at higher prices than in January 2024, signaling optimism or increased demand.


Higher-end markets and certain ZIP codes saw the biggest price jumps, while some areas remained steady.


Larger and newer homes make up more of the market, pushing average list prices higher.


Average Days on Market Sold Price to Original List Price %
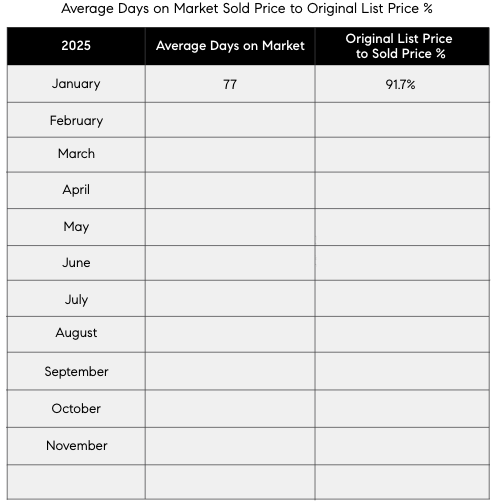
 

The Average DOM shows the number of days a property was on the market before it sold. An upward trend in DOM indicates a move toward a Buyer’s market.


The Sold Price vs. Original List Price reveals the percentage of the

Original List Price properties sold for.


Monthly Supply of Inventory
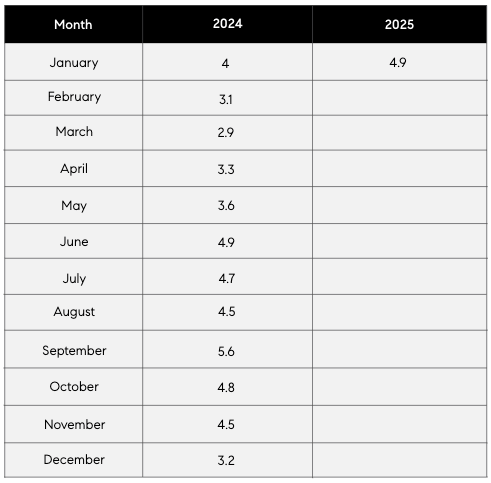
 

Real estate economists tell us a six-month supply of For Sale Inventory represents a balanced market between sellers and buyers.

Over six months of For Sale inventory indicates a Buyer’s market.Less than six months of inventory indicates a Seller’s market.


New Listing Taken | New Under Contracts


Leave a Reply

Message

Name

Phone*